
Dancing with Data: How Marine Contractor Van Oord Pinpoints Opportunities for Sustainability Investment
Qlik
Climate change is the emergency of our time, but discussions about how to fight climate change are much more nuanced than they might first appear.
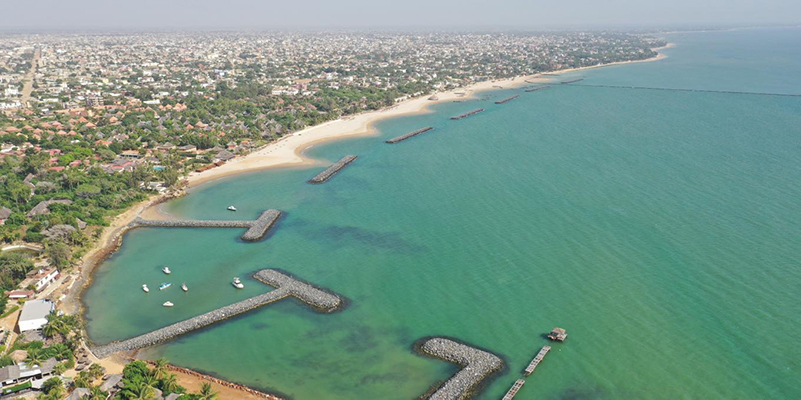
A city in a developing country may need a harbor to transport goods and provide a livelihood for the people who live there. But creating such a harbor will significantly impact the coastline, potentially inflicting damage to mangroves that capture carbon. The truth is, we all have an impact in one way or another. At Van Oord, we strive to ensure the net effect of our actions is positive.
Van Oord is a Dutch family-owned company that draws upon over 150 years of experience as an international marine contractor. Our areas of expertise include land reclamation, offshore infrastructure such as wind turbines, port and waterway development, and shore restoration. When I arrived here in 2014, I felt my career path had come full circle.
I originally studied civil engineering before I made a detour into oceanography, completing my PhD and spending a decade as a research scientist. While working as a scientist, I also became a data expert. At Van Oord, I brought all of these worlds together through an opportunity to create a Datalab that would positively affect the planet in years to come.
For the Most Remote of Remote Engineering Work, Self-Serve Data Is a Must
As the Datalab Manager at Van Oord, I learned about the various aspects of our business. And when it came time to select our business intelligence (BI) tool, I was amazed by the available options. One tool in particular addressed our unique business needs: Qlik Sense. I previously used Python to create visuals, but it always took so much time. Qlik offered many more possibilities for visualizations and self-serve data. Users could play with the data themselves and customize visualizations to their liking, allowing me to spend more time collecting data and investigating the stories the data tells.
Qlik enables all users to handle data without getting into more complex systems like Python. It’s much easier to use, with a simpler interface. The self-serve aspect of Qlik is critical because Van Oord is an asset-driven company, and the nature of our work is remote. Our engineers are in different time zones and often need to make decisions based on accurate and reliable data in real time—they can’t wait for decisions from headquarters. Qlik dashboards facilitate this activity, allowing the company to move faster and at scale.
As an engineering firm, we employ people with strong technical abilities, and they have equally strong opinions about the right way to do things. If one person makes a dashboard, chances are it won’t be how someone else would have designed it. Qlik is intuitive enough that engineers can create their own dashboards. The engineers get exactly what they want, with the added benefit of making everyone owners of the data. That sense of ownership was crucial for adoption as I grew Qlik usage from just one person (me) to more than 500 users across the company.
As people take ownership of the data, they also take ownership of the data quality. Many of our users work on the ground in areas where they might not be able to verify data immediately. Working in Qlik, errors in data are much more apparent than in Excel. Using Qlik, we have created a nice feedback loop where we continuously improve the data collection in these places.
Pinpointing the Best Bets for Investment
In 2020, Van Oord decided to take more significant steps to address the climate emergency. As part of the company’s 150th birthday celebrations, we invited Christiana Figueres, the lead negotiator for the Paris Climate Agreement, to speak. We all know the individual actions we have to take as individuals to reduce CO2 emissions, and governments have a massive role to play, too. But Christiana reminded us that private companies also have a big responsibility. Van Oord is a family company, and we don’t have public shareholders. This freedom affords us the luxury of taking the longer time horizon required for investments in sustainability projects. Van Oord vowed that we would share with the world any tools we built to increase our sustainability efforts.
Van Oord’s sustainability program has four pillars:
- Enhancing the energy transition
- Accelerating climate actions
- Empowering nature and communities
- Achieving net-zero emissions
As part of this program, we developed our Climate Adaptation Action Plan to work with local stakeholders in providing ready-to-scale marine solutions that increase the resilience of the communities and ecosystems of coastal areas. We do this by building with nature: We use nature-based solutions like mud, sand, mangroves, and coral for coastal infrastructure projects. Sustainable development is about working toward the net positive, for people and the planet. By harnessing the forces of nature, we can prevent flooding and reclaim coastal areas to benefit the economy, society, and the environment.
The big question became, where in the world should Van Oord invest? As I later learned, there are around 60,000 possible coastal locations where we could do this work. Even narrowing the field to mangrove and coral restoration left us with a vast area to consider. With my background in science and BI, Van Oord asked me to help pinpoint 10 locations around the world that the climate adaptation team could investigate further to make a business case for investment.

Only One Solution Provided the Interactive Visualization We Needed
I started by finding all the available open-source data, but I ran into the problem of how we would visualize and make all these data sets interactive. The data sets were also massive. Working on a global scale means amassing terabytes of data, which is unmanageable for a user working on a laptop. (Our intended users didn’t need that level of detail, anyway.) We envisioned these climate adaptation projects benefiting a small city. Considering the typical size of a community where we could work with the local government to approve a project, we aggregated the data into 10 km² units, resulting in 60,000 data points.
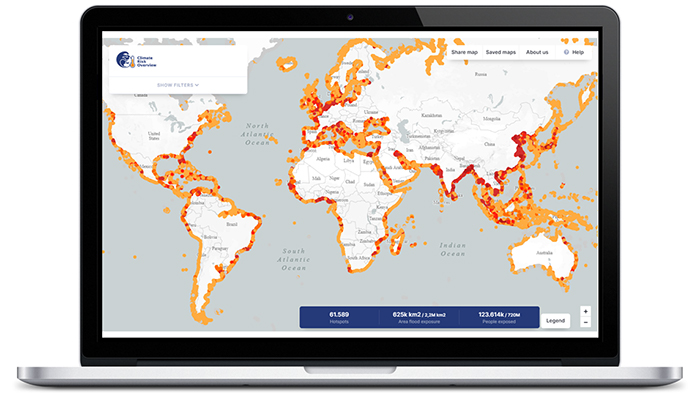
Visualizing this data through Python or Excel wouldn’t work even at this much-reduced level of detail. And PowerBI has a cap on data points on a map—no more than 3,500. Qlik, however, is technically limitless. Looking at the global map in Qlik, we figured out how to make the visualization fast and interactive, with options to select by country, or on a sliding scale for mangroves, tropical corals, and population exposed to flooding. The truth is no one wants data—they want useful information. Within an hour of feeding previously siloed data into Qlik, we had an interactive map that showed users our best bets for sustainability investment.
We named the project the Climate Risk Overview (CRO) and launched it in 2021. The CRO app helped us identify 10 locations around the world—in countries including Mozambique, the Maldives, the Bahamas, and Vietnam—as potential targets for investment. We are now in the process of signing memoranda of understanding with local governments, so we can send our teams to these locations and begin the on-ground investigation. We then plan to iterate and revitalize the CRO with new data to look for another 10 locations.
The CRO arose from a need that no one had addressed: uncovering business opportunities while fostering conversations around the world about climate adaptation solutions. We have had chats about the CRO with the Global Center on Adaptation (GCA) and the Ocean Risk and Resilience Action Alliance (ORRAA), among other external partners. We are growing a community, and as we continue to invest in and share the CRO, we hope our community will take the tool even further.
Data That Makes Space for Human Stories
Apart from our internal business case, we’ve created an open version of the CRO for the general public. We showed our Datalab software developers the CRO within Qlik, and asked them to recreate its look, performance, and interactivity. They did—and now we’ve come to view Qlik as a rapid development and prototyping tool for Van Oord Datalab software development. As we build new data layers into the CRO, we make them in Qlik first before adding them to the public web version. We are running out of time for climate solutions, so anything that helps us hasten the development process is essential. This project wouldn’t have had the same speed and impact without Qlik.
Data can do a lot. Empowering our climate adaptation discussions with data gave us 10 hot spots with true investment potential. Once we knew where to look, we could perform a second data analysis, looking at more detailed data exclusively on the local level. But data isn’t the answer to everything, and there are many stories that can’t be told with data.
I had an MSc student spend an entire year trying to find a meaningful measure of community resilience, for example. She discovered that all the global data sets—from the World Bank to the United Nations—have limitations. Finding places with investment potential involves more than just crunching the numbers, because global data omits many relevant details. On the other hand, human storylines are subjective by nature.
We want to achieve a kind of tango, where the story dances with the data. We like the CRO because it helps make subjective discussions a bit more objective, leaving room for conversation.
Opening Avenues for Collaboration and Action
Van Oord has become more than a contractor through new and continued partnerships around this project. We’ve added value to the public space, making us collaborators with knowledge institutes, development banks, and NGOs. Climate adaptation solutions are years in the making—they can’t be tacked onto a development at the last minute. By becoming a collaborator in this global community, Van Oord is now involved in planning conversations at their earliest stages—before anything is decided, zoned, or built.
Van Oord is a marine contractor, so we make what society requests. Still, we want to create solutions in the best possible way for the planet. Everyone has opinions about the best route to sustainability. We are in the process of determining what decisions can result in a net positive effect. Qlik enables us to use data to determine the best way to achieve that goal, and to gradually make it more objective, which is good for business and the planet.


