
The End-to-End Architecture to Support 45,000 Analytics Users (with the Performance They Deserve)
Qlik
Scaling analytics to 45,000 users worldwide is no small task. It requires a delicate balance between the freedom to explore data and finding ways to ensure quality. Training and onboarding add even more complexity to the mix. But without adequate performance, nothing else matters. Creating a BI platform that runs smoothly is of the utmost importance.
Under such an extensive administrative weight, decisions like architecture, design, and caching become critical dilemmas. Even in cases where the system “works,” the ongoing need to find improvements in speed and capacity is a serious undertaking.
As one of the largest pharmaceutical companies in the world, Novartis has more than 110,000 employees. We create a wide range of products, including prescription medicines, vaccines, diagnostic tools, contact lenses, and more. Whether you have a severe condition or a queasy stomach, we have something for you. In one form or another, our company or its predecessors have been improving lives through chemistry since the 1800s.
Our journey with Qlik began in 2011 and has been a considerable success. We’ve grown to 45,000 users who undertake nearly 4 million Qlik Sense sessions per year. Each of these users is dependent on the platform to find the insights they need to make smart decisions. They deserve a platform that runs as smoothly and reliably as possible.
Finding Focus and a Plan for Large-Scale Performance
When dealing with tens of thousands of users, various factors can hinder performance. Platform and network architecture can strongly impact scalability and the ability to allocate resources as needed. Application sizing, design, and caching mechanisms can impact loading speeds. However, given the size of our operation, we needed a way to narrow down end-user performance to a few factors.
We chose to focus our efforts on improving end-to-end performance. Certainly, that includes the time to load an application or complete a computation using Qlik Sense. But this also considers the time to transfer static and dynamic content onto the user’s device, and application rendering time. We also have to think about data volume, the number of requests, resource sizes, bandwidth, and much more. With this being a web-based application, the age of the user device can also impact performance.
Each of these factors gets more complicated upon looking closer. Most importantly, these only scratch the surface of our total considerations. We chose to break the project down into a number of steps focused on a single element.

Optimizing Location and Device Rendering
The first step of our project to improve performance began with examining location. Being a worldwide company, our architecture and staff are located on several continents. Before anything else related to optimization, we had to get our servers closer to the users. We knew from experience that extreme distance can slow transfer rates. Because of the size of our operation, shaving off even seconds would add up to significant improvements.
In this case, we moved a server located in Europe to the Singapore data center. This maneuver cut the time to transfer content from the server to the client in half. Prior to the relocation, it took anywhere from 40–52 seconds to transfer certain content. Upon completion, the same transfer could be achieved in less than 25 seconds.
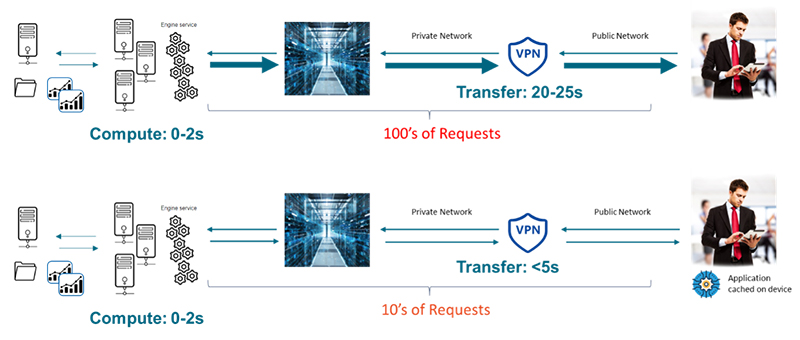
The second step we took was to shift from a rendering on a central platform to one powered by Qlik on the end user's device. By keeping a minimum version of the application cached on a select number of end-user devices, we can potentially reduce the overall transfer time by 5–10 seconds. Because of the number of Qlik users, the server and network can easily receive hundreds of simultaneous requests. If each of these requests involves fully loading the application on the device, that explodes the amount of data being transferred. On the other hand, the greater the number of locally cached applications, the bigger the reduction in transfer requests.
We accomplished this by creating a mobile application framework with PWAs (Progressive Web Applications). Users on this new system will experience faster application launches and a better overall user experience because we spread the work to a number of devices.
Fixing the Server Caching Challenge
Since we use the Qlik Sense servers, web content is often transferred through our servers and to the user device. We noticed that the time it takes to transfer data through the server increased during peak hours. At one point, we measured this transfer process and realized that it took an average of two seconds to serve any web content. That meant that an extension with 20 files could take 40 seconds to completely transfer. Of course, this doesn’t factor in files loading in parallel, but it still adds unnecessary load time.
We decided to move some of the most commonly used files to a more local server. That way, when Qlik Sense users access the system, they won’t need to download as much material from the web. We ultimately used NGINX Reverse Proxy and cached some content within that service. Using that process, we were able to shave another 15–20% of the time it takes to load the application.
The final challenge was examining some ways to improve load time on the client side. Here, we tested the time it took to load Qlik Sense onto a mobile device before we installed the custom PWA. It took a total of about 23 seconds before it was ready to use. After we added our PWA to the mobile device, the same load took about six seconds.
Once again, this was accomplished because the PWA keeps certain necessary files cached onto the mobile device. However, we don't include files related to designing an application, adding a new sheet, or configuring charts. By maintaining an environment containing only what we need, we dramatically improved the user experience at the client device level.
Predicting Performance
The one final topic to cover is the potential formula for predicting performance. We embedded code into our servers that measured transfer and loading times for every transaction, and then analyzed the results. Through our efforts, we developed a formula that we believe gives insight into system performance. Interestingly, we found the network was the biggest predictor of latency.
Specifically, take the number of requests multiplied by the network latency in milliseconds. Divide this number by 1,000 and then add the static content size. This measurement essentially takes the sum of all files to be transferred and divides by the network bandwidth in Mbps. You can make your own calculations if you are using 3G or 4G networks, but this can help you understand the true end-to-end performance.
Hopefully, using this formula can provide some benefit to those considering ongoing performance improvements. We found that caching at the local server or end-user device improved the user experience by reducing the size of the files moving over the network.
The prospect of 45,000 worldwide users of Qlik may be intimidating to some, but it shouldn’t be. With the right optimizations, you truly can provide data at the fingertips of your employees across the globe.


